The standard model (SM) of particle physics, is the most successful theory describing the behaviour of elementary particles and their interactions. However, the SM has a few serious shortcomings, such as the Higgs boson mass problem. The mass of the Higgs boson calculated in the SM framework can be arbitrarily large because of certain effects known as quantum fluctuations. However its value has been measured to be 125 GeV, by the ATLAS and CMS experiments. This discrepancy can potentially be addressed by a supersymmetric (SUSY) extension of the theory, which complements the SM particles with SUSY counterparts, as shown in Fig. 1. The interactions of SUSY particles with the Higgs boson mitigates its mass problem. The theory also provides potential candidates for explaining dark matter. Since the Higgs boson primarily interacts with massive particles, the heaviest known particles, the top quark and its superpartner (top squark), play a central role in solving the Higgs boson mass problem. Hence, it is of great importance to probe the existence of the top squark. We look for it in all possible ways (Searching for top squarks with CMS data) to make sure we do not leave any stone unturned.
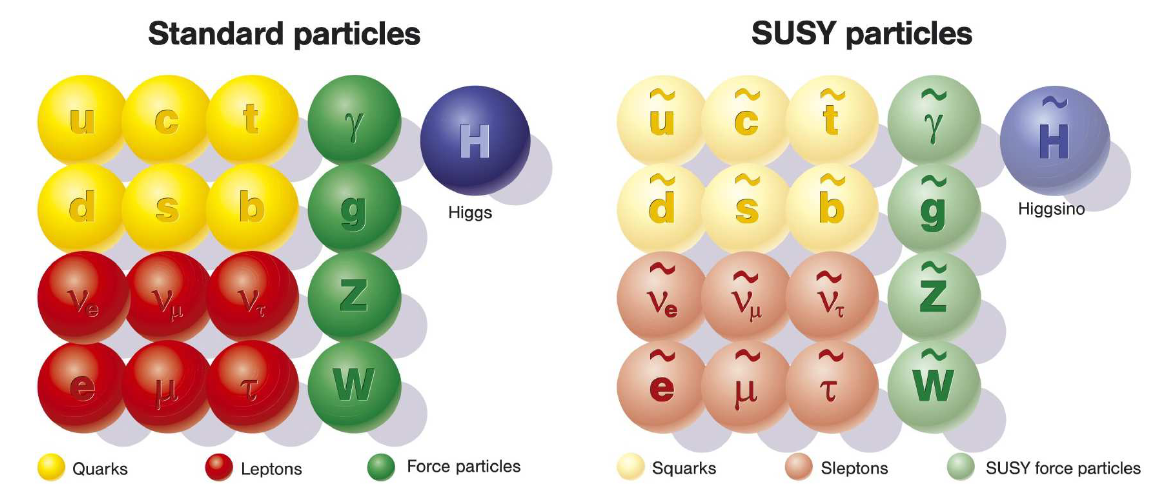
Figure 1: The Standard Model and SUSY particle content. From M. Grefe, “Unstable Gravitino Dark Matter – Prospects for Indirect and Direct Detection”, arXiv:1111.6779.
The masses of the SUSY particles, as well as various other parameters of the theory, are unknown and have to be determined experimentally. Given that they might be within wide ranges, the production of massive SUSY particles in proton-proton collisions can result in a diverse variety of experimental signatures, arising from their decay products. In this study we have investigated scenarios where the top squark undergoes a cascade decay, producing a bottom quark (b), a tau lepton (𝜏), a neutrino (𝜈), and a neutralino. The neutralino is assumed to be the lightest superparticle and can potentially be a candidate for dark matter. This SUSY process (the "signal”) is quite unique, as schematically illustrated in Fig. 2, and reflects a certain type of configuration of the SUSY parameters.
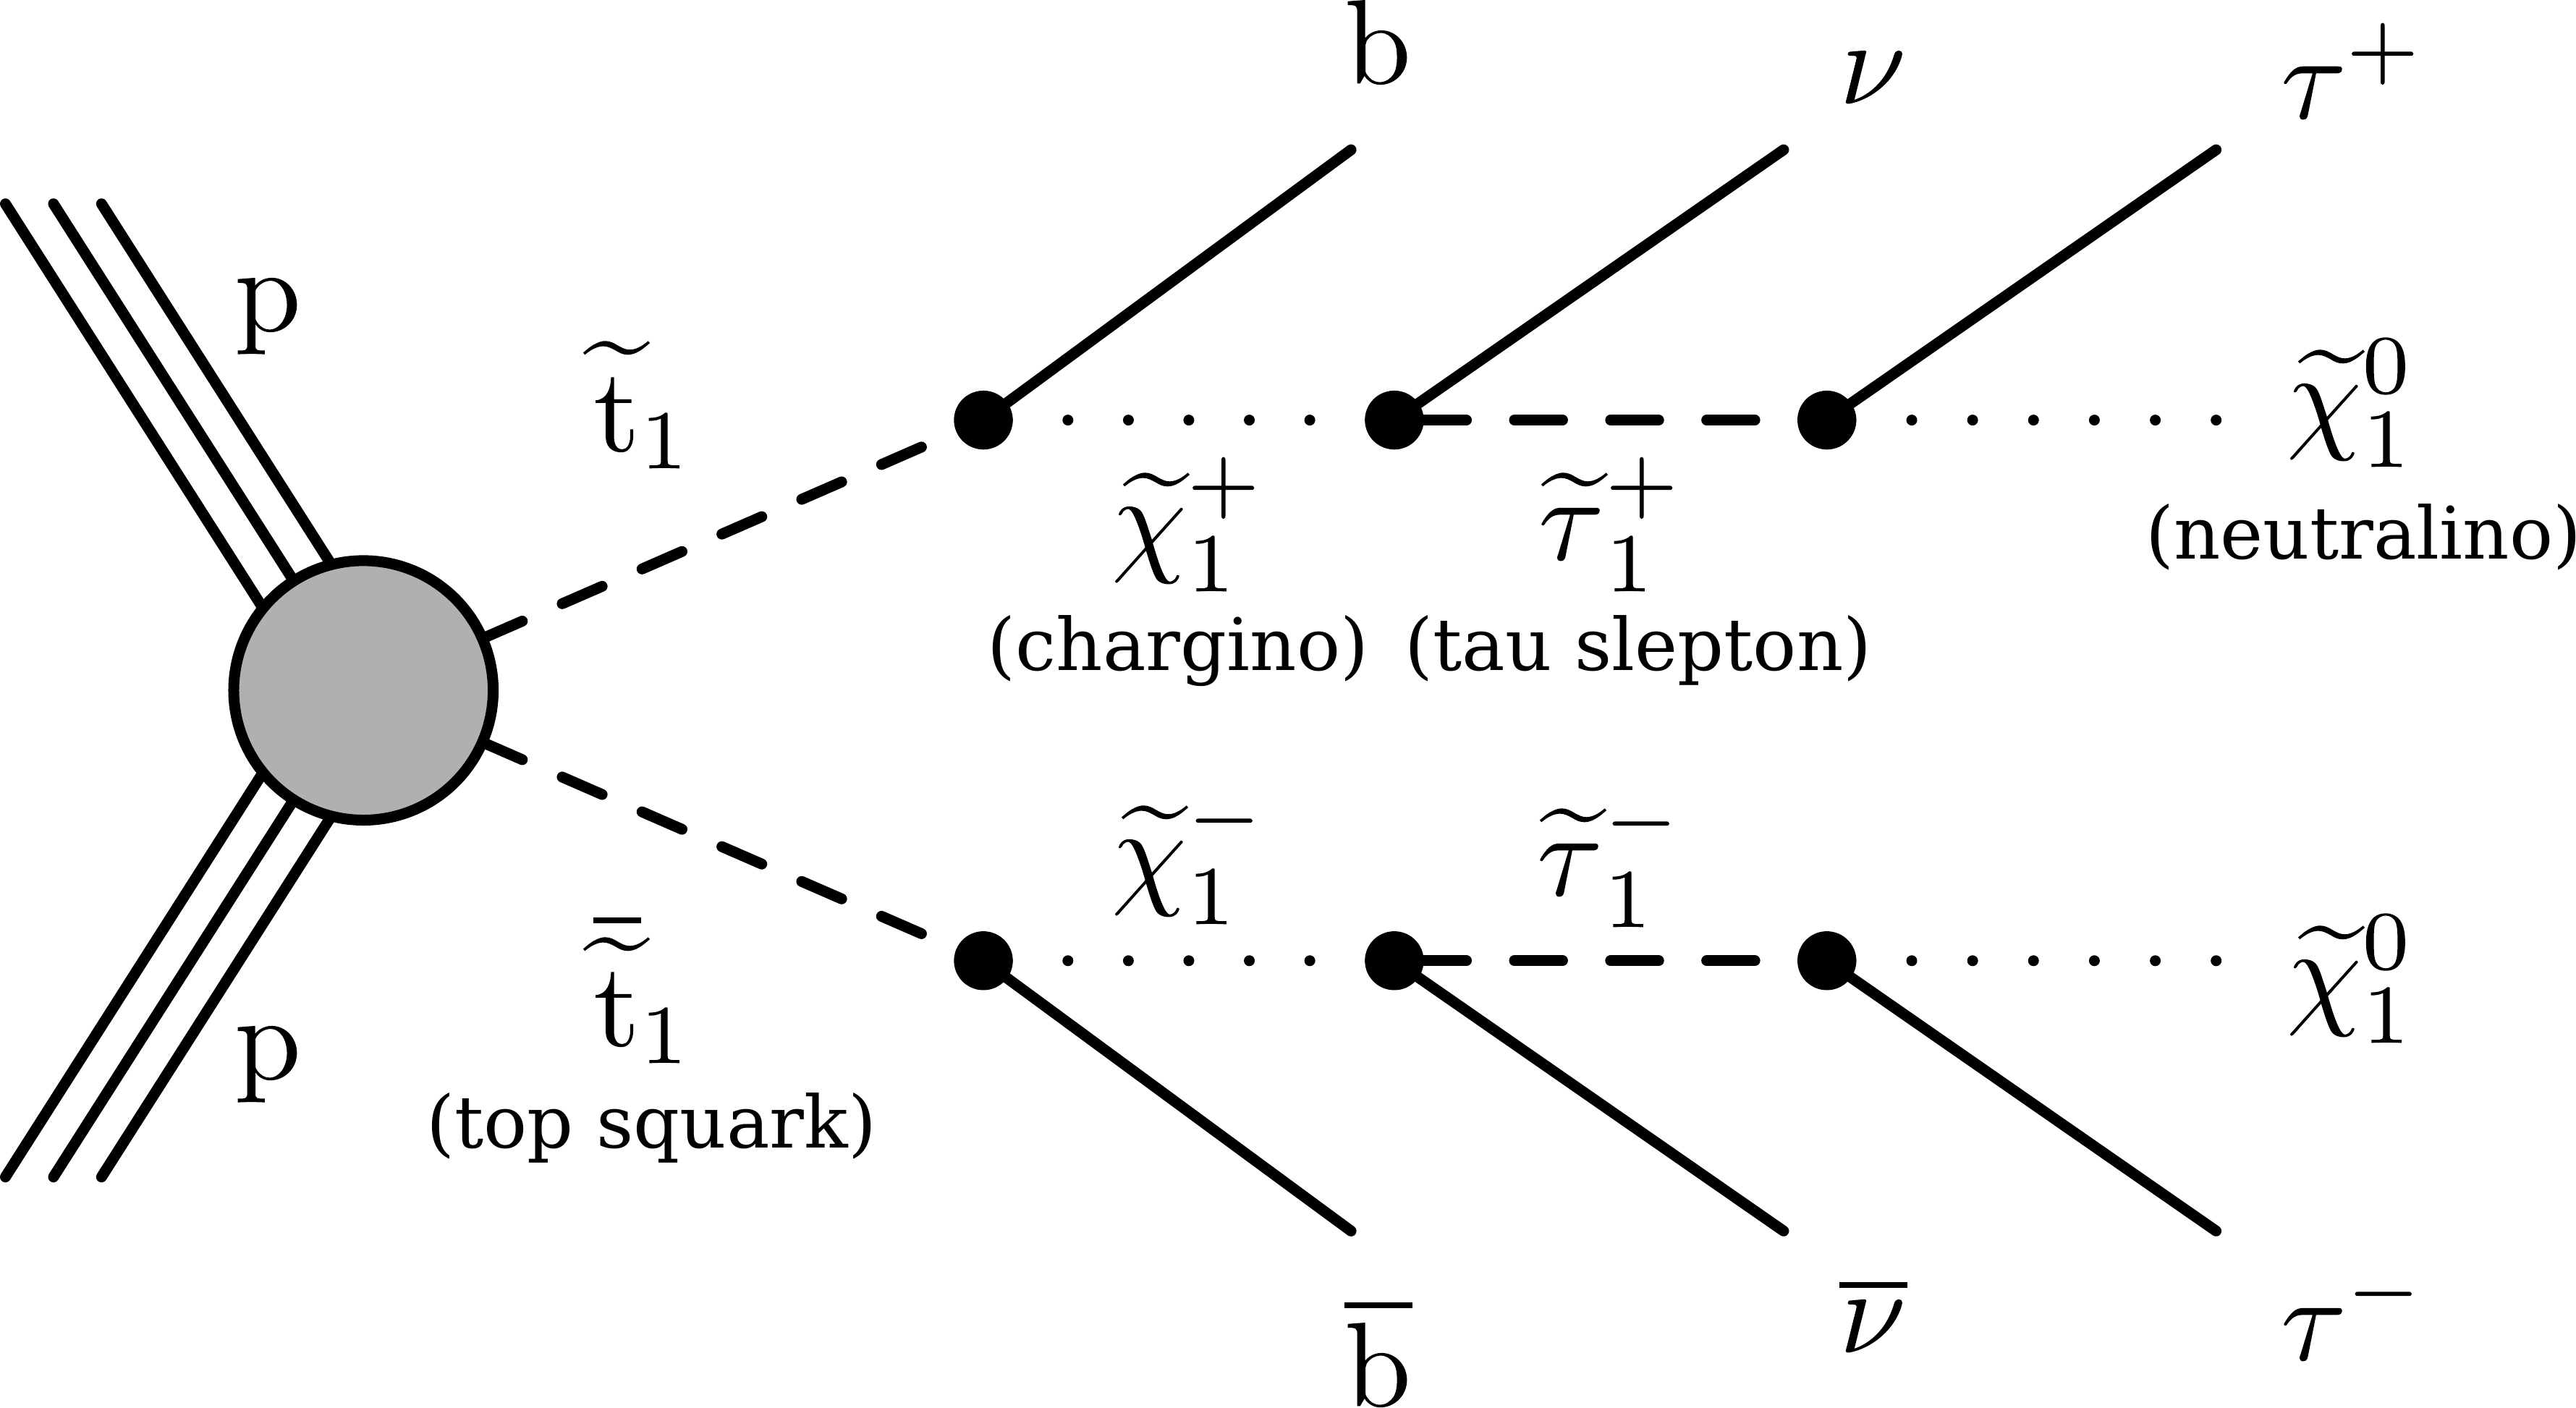
Figure 2: A top squark pair is produced in a proton-proton collision, leading to pairs of bottom quarks and tau leptons accompanied by neutrinos and neutralinos.
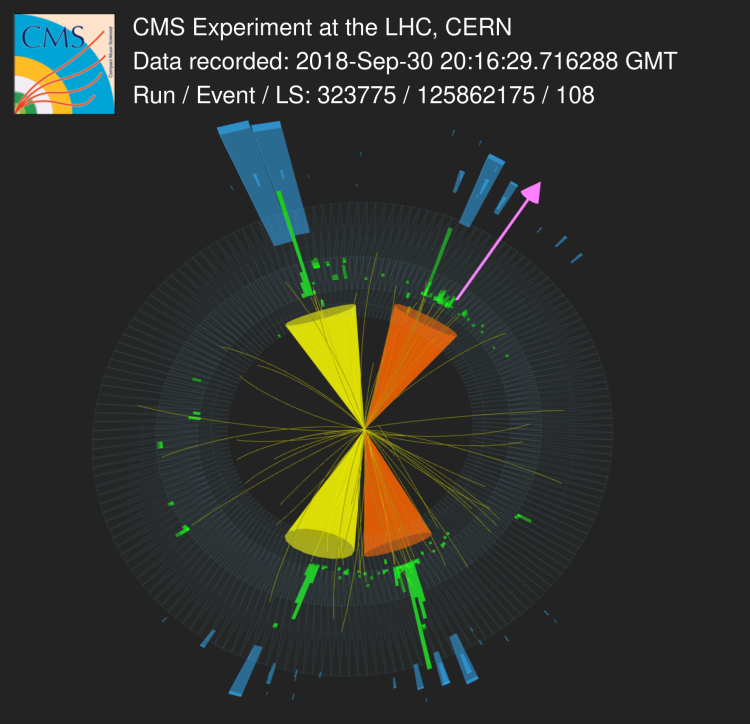
The signature of the signal is characterised by the presence of two bottom quarks and two tau leptons in the final state. The bottom quark produces a collimated beam of hadrons, called a jet. In addition to that, there is also a large amount of missing momentum as the neutrinos and neutralinos do not interact with the detector and escape undetected. The tau lepton decays to hadrons (65% of the time) or to an electron or a muon (the other 35%). Different search categories are considered depending on the tau decay mode: the fully hadronic category, where both tau leptons decay to hadrons, and the semileptonic category, where one tau lepton decays to an electron or a muon, and the other to hadrons. These hadrons also form a jet. The identification of jets produced by bottom quarks and hadronically-decaying taus is a very challenging task at the LHC. Sophisticated machine learning techniques are employed for this purpose, to minimise the rate of false positives. Figure 3 shows an event collected by the CMS detector, with a signature consistent with two tau leptons, two bottom quarks, and a large missing transverse momentum.
Figure 3: An event seen by the CMS detector, consistent with two tau leptons producing jets (yellow cones) and two b quarks also producing jets (orange cones). The yellow lines represent tracks from charged particles. The transverse component of energy deposits in the electromagnetic (ECAL) and hadronic (HCAL) calorimeters are represented by green and blue towers, respectively. The length of a tower is proportional to the amount of deposited energy. The missing transverse energy is represented by the pink arrow. Try to rotate and zoom!
As is often the case, this search suffers from contamination by “backgrounds” -- imposters that give rise to similar final states and mimic the behaviour of the signal. An important background is the contribution from the pair production of top quarks. Another major source of background events results from misidentified hadronic taus. These backgrounds can, in principle, be evaluated by simulation, but even our best simulations suffer from shortcomings that make them unsuitable for this search. To get around this problem, we estimate the backgrounds directly from the measured data.
In order to maximise the signal sensitivity, we have carefully selected three variables to discriminate between the signal and background processes. These variables are used to significantly suppress the background contribution, therefore making it easier to detect the potential contribution from the signal process. The three variables are sensitive to the total visible energy and missing momentum in the process, together with certain other properties of the aforementioned cascade decay. Using these variables, we define fifteen bins, which help to probe different hypotheses for the top squark and neutralino masses. In each bin, the measured number of events is compared to the predicted number of background events. If consistent with the signal prediction, significant differences between the background prediction and the observation would indicate the presence of supersymmetry.
We have not observed any such deviation so far. But the absence of a discrepancy can be turned into a useful conclusion: we can interpret the results to infer which hypothesised values of top squark and neutralino masses can be excluded. The excluded region is bounded by the solid black line in Fig. 4. From this search we can rule out top squark masses up to 1150 GeV when the neutralino mass is 1 GeV, and neutralino masses up to 450 GeV when the top squark mass is 900 GeV. Knowing where SUSY does not exist is important to design future searches, so that new and improved strategies can focus on exploring the regions that are not yet excluded.
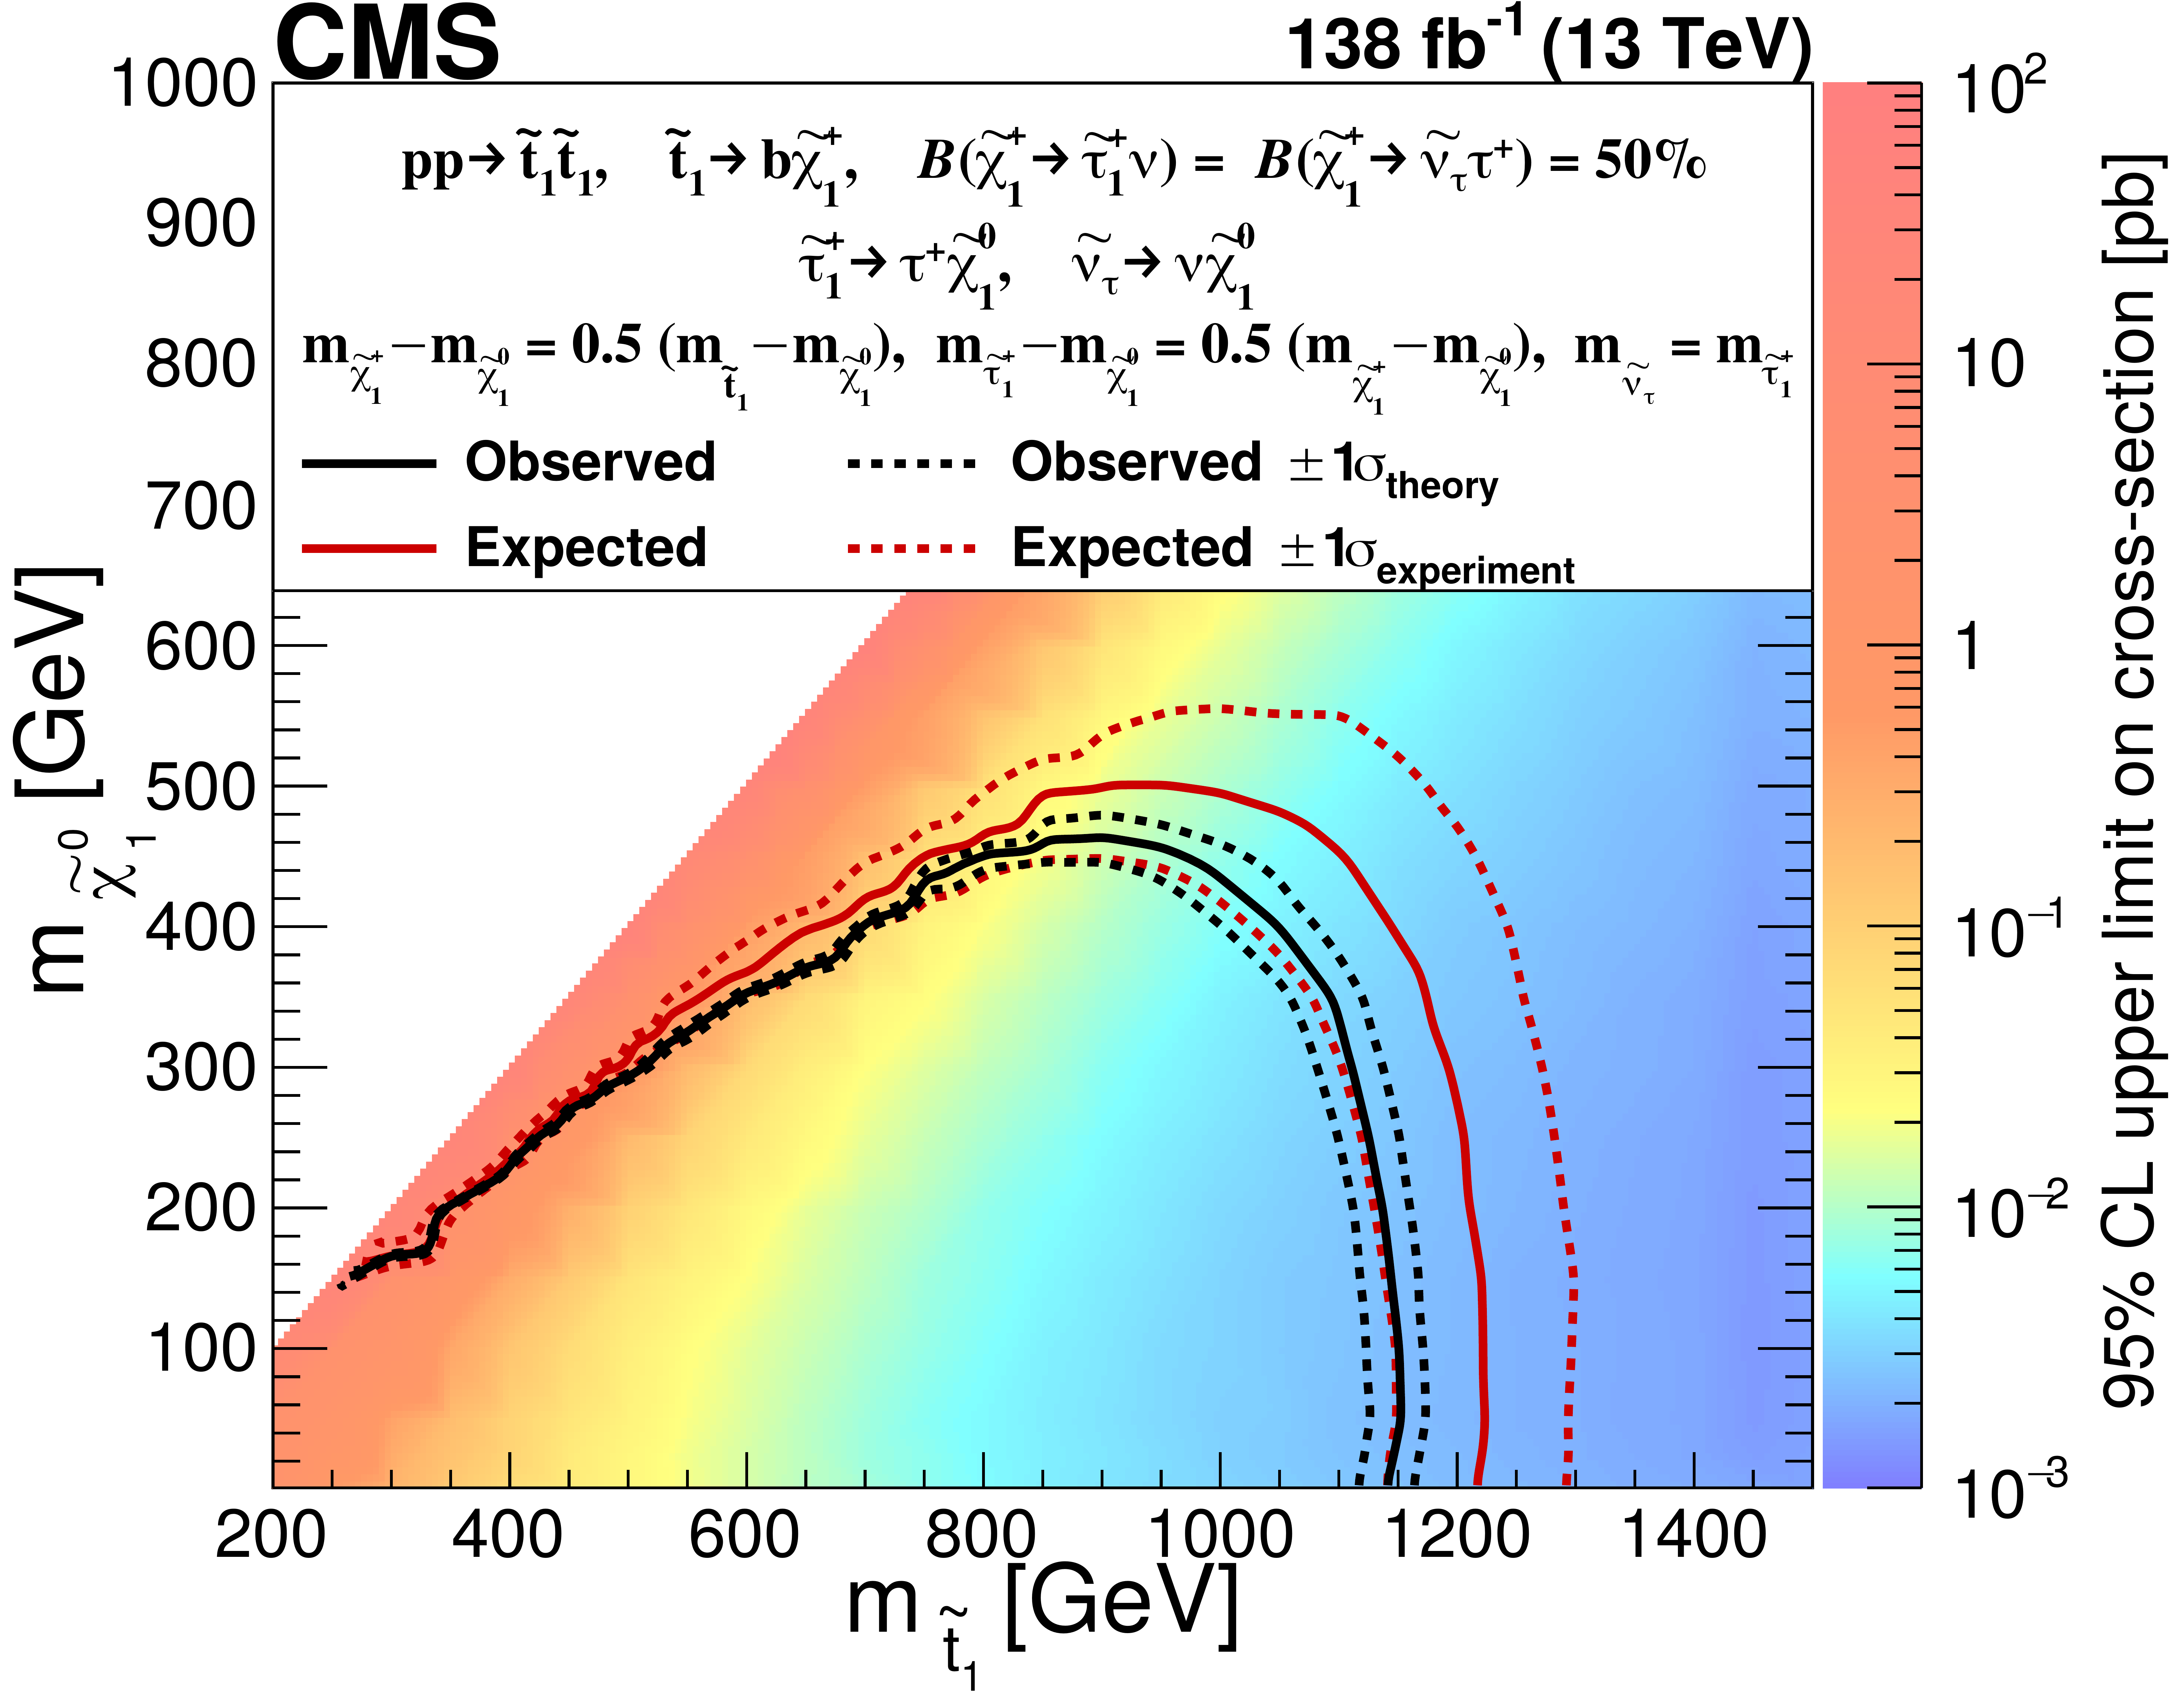
Figure 4: The horizontal and vertical axes denote the masses of the top squark and of the neutralino, respectively. The region within the solid black line has been excluded.
Read more about these results:
-
CMS Physics Analysis Summary "Search for top squark pair production in a final state with at least one hadronically decaying tau lepton in proton-proton collisions at 13 TeV"
-
@CMSExperiment on social media: facebook - twitter - instagram