What is the Universe made of? Searching for the answer to this question has been the main quest of particle physicists. Part of the answer is provided by the highly-successful Standard Model (SM) of particle physics, whose last achievement is the discovery of the Higgs boson with a mass of about 125 GeV. The model is however unable to explain a number of observations such as the mass of neutrinos and the existence of dark matter (DM). Also, if SM would be the ultimate theory of our universe, the mass of the Higgs boson could not be finite!
Supersymmetry (SUSY) is one of the theories that provide answers to some of these open questions, by introducing a superpartner to every particle in SM. The mass of the Higgs boson can stay finite because these new particles can also interact with the Higgs boson. Here, the superpartner of the top quark, stop, plays a special role because of its large coupling to the Higgs boson. In addition, SUSY predicts the lightest supersymmetric particle (LSP) to be neutral and weakly interacting, that cannot decay to the particles we know, meaning that it cannot be detected. Therefore it is a viable candidate for DM.
If SUSY is realized at the TeV (trillion electron-Volt) scale, supersymmetric particles could be produced in proton collisions at the LHC. The DM particles do not interact in the CMS detector and they leave a signature of high missing transverse energy, evaluated by imposing that the total energy is conserved.
 |
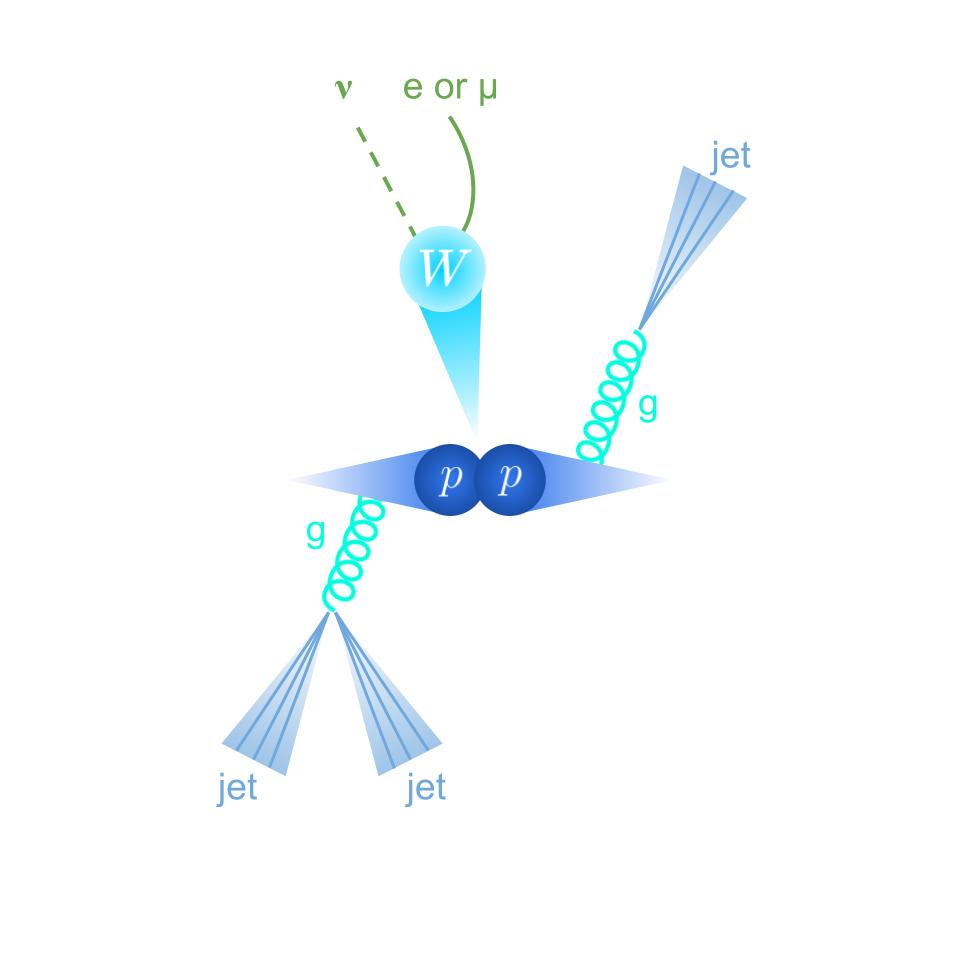 |
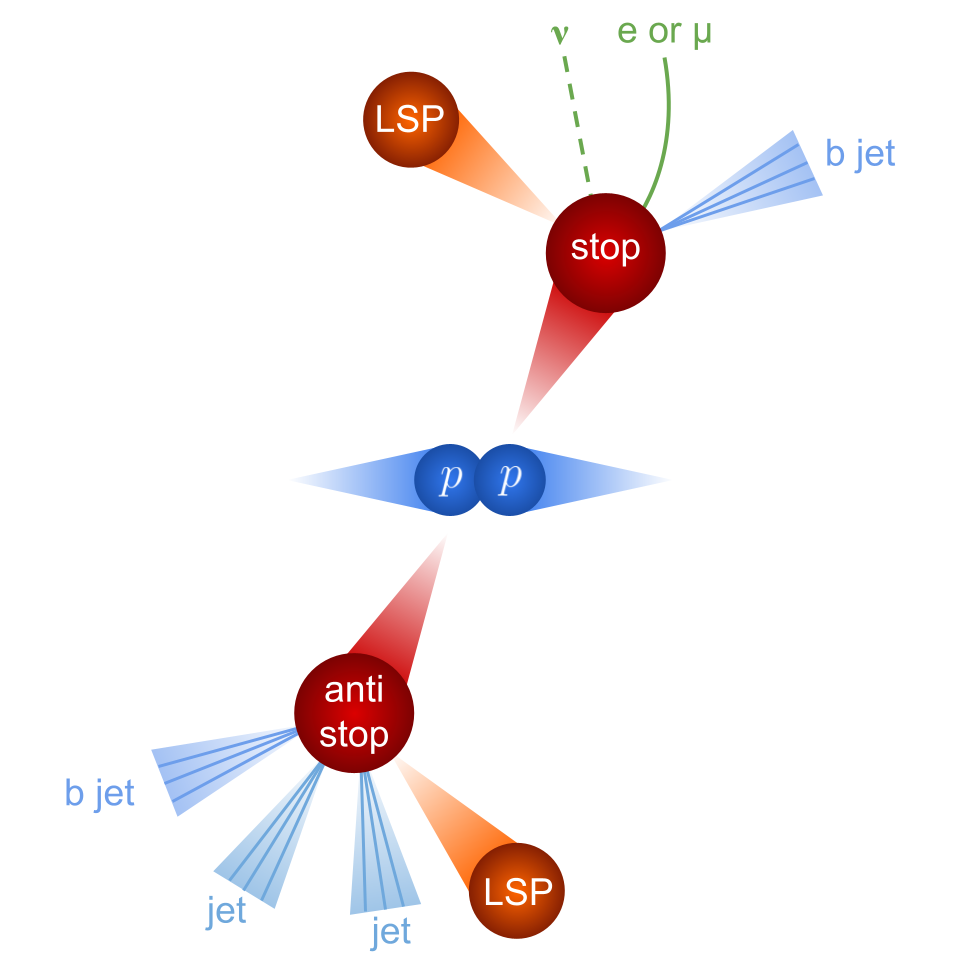
Figure 1: Illustration of proton-proton collisions producing a top squark pair decaying in a single-lepton final state (left) and a W boson with additional jets, as an example of the SM background (right).
CMS has recently performed a search for stops in the compressed scenario, a very challenging scenario where the mass difference between the stop and the LSP, Δm, is smaller than the mass of the W boson. The left diagram of Fig. 1 shows the signature of the SUSY signal that we are discussing here: two stops would be produced and decay into one charged lepton (an electron or a muon), several jets, and two neutralinos plus one neutrino (leading to large missing transverse energy in the event). Certain SM processes, such as the one illustrated in the right diagram of Fig. 1, lead to similar event topologies and constitute a “background” that needs to be carefully quantified. The question that we address through the data analysis is: “Is the number of observed events accounted for by the expected (SM) background, or are we seeing an excess of events due to a contribution from SUSY particle decays?”. Let’s now go over our strategy!
This scenario is particularly challenging because of the limited phase space and the kinematic similarities between SM and signal. To tackle this challenge, this analysis procedure separates the signal and background contributions by feeding their most important differences into a Machine Learning algorithm called Boosted Decision Trees (BDTs). We train a BDT for each Δm region, to optimize the efficiency of the search, given that the kinematics of the signal depends on Δm. This novel strategy allows us to probe kinematically difficult regions and improves the sensitivity compared to other similar SUSY searches.
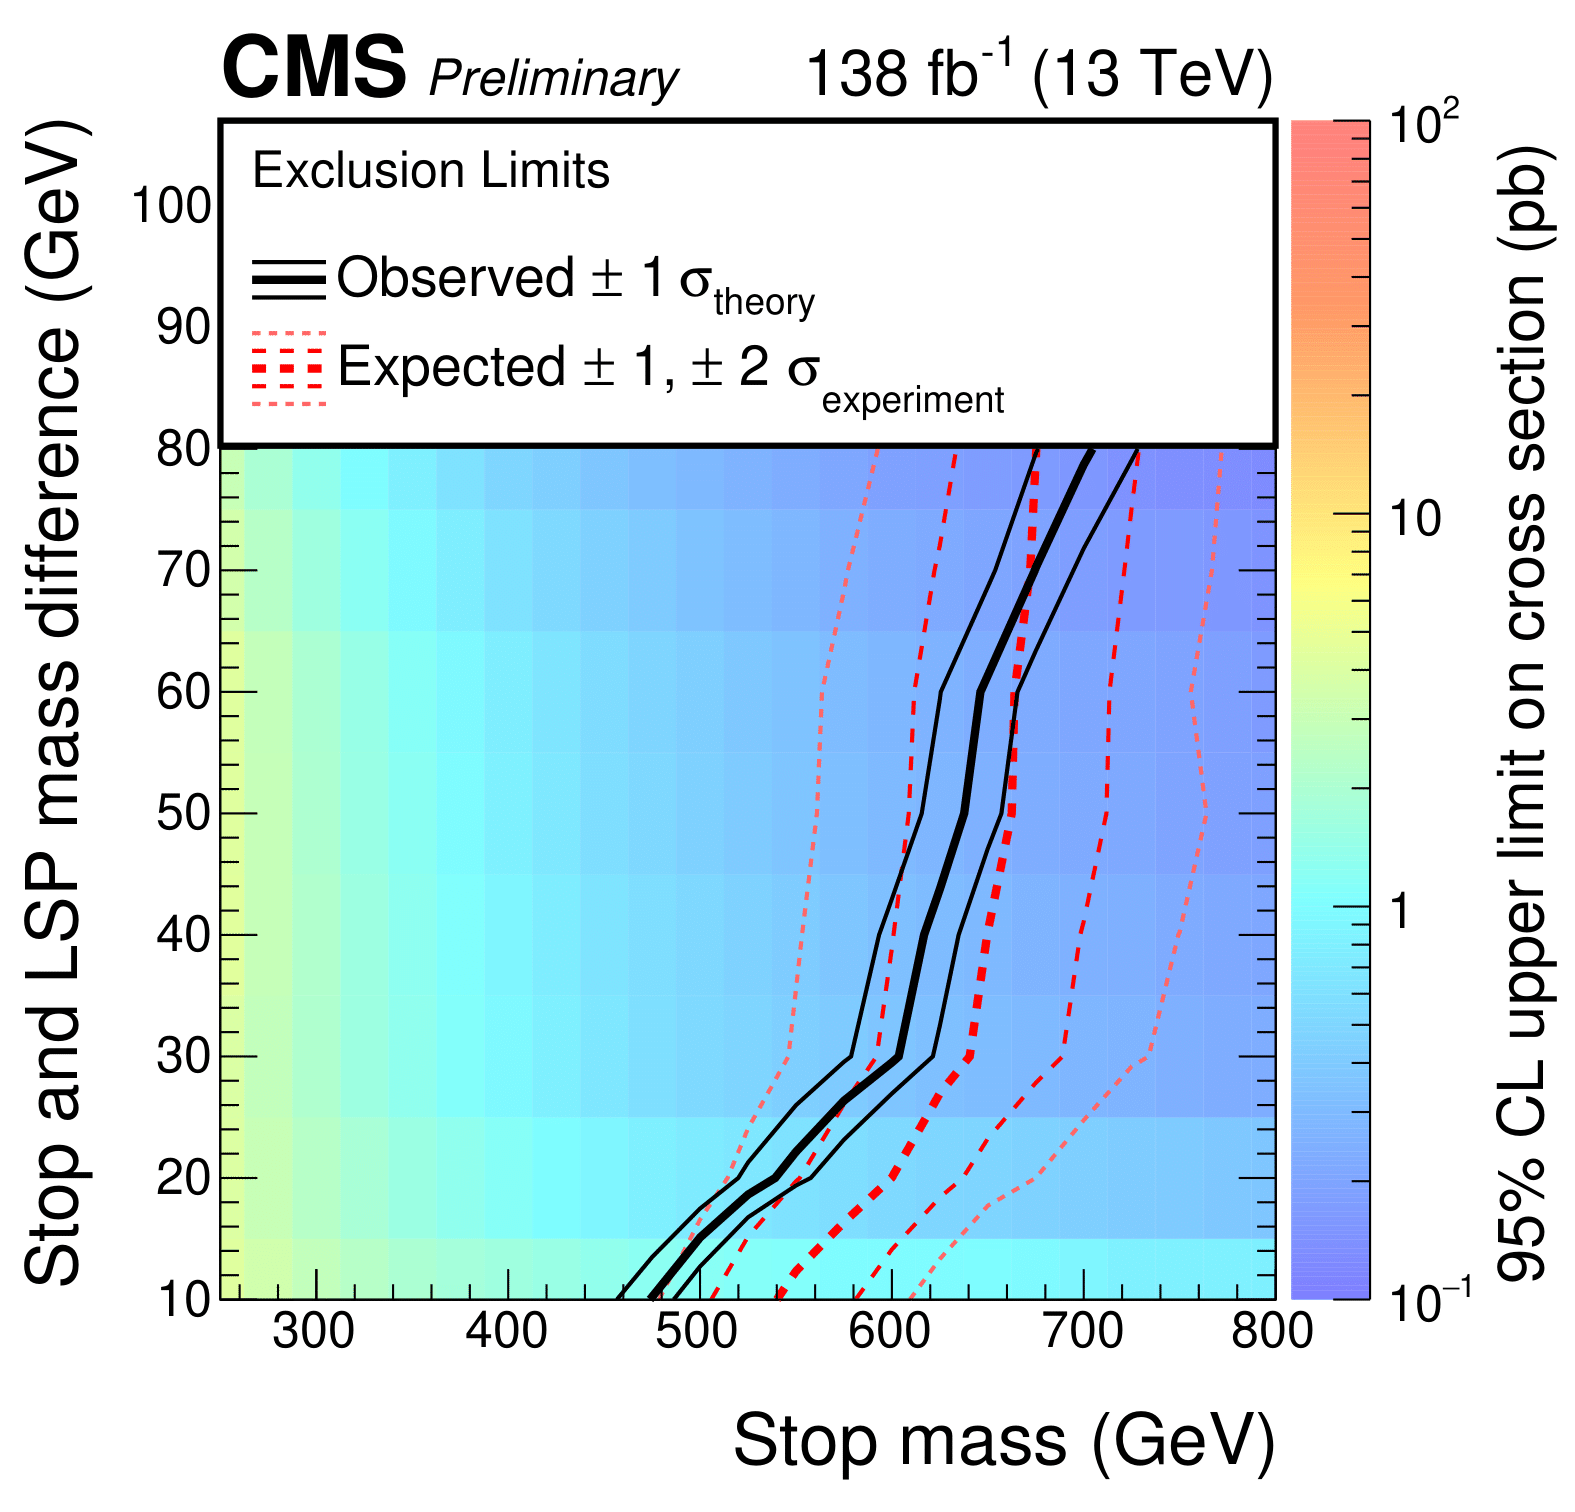
Figure 2: Exclusion limit for the four-body decay of the top squark (represented in Fig. 1) as a function of the stop mass and of Δm, for the data sample collected in 2016–2018. The color shading represents the observed limit on the cross section for a given stop and LSP mass hypotheses. The black and the red lines represent the observed and expected limits, respectively: the area to their left is excluded.
The final result of the search is shown in Fig. 2. The red lines represent how sensitive the search is expected to be, for different stop and LSP mass hypotheses. If the SUSY signal is in the areas to the right of the red lines, we should not be able to see it, given the predominance of SM events. The black lines represent the result of the analysis. They do not coincide with the red lines because the measurements and predictions have uncertainties, but we can say that the data is in agreement with the SM prediction for most of the probed Δm range. The only exception is seen at the lowest Δm values (close to 10 GeV), where the data exceeds the expected SM background; the significance of the excess is approximately 2.5 standard deviations, meaning that we expect to see such a result with a probability of 1/160 even in the absence of SUSY.
This new strategy of using BDTs optimized for the different Δm regions made us sensitive to more challenging signal types that would have been missed by the previously published analysis. With this recent analysis, we have reduced the allowed parameter space and will target what is left in the next data-taking period of the LHC with more data giving us more precision.
Read more about these results:
-
CMS Physics Analysis Summary "Search for top squarks decaying via the four-body mode in single-lepton final states from Run 2 of the LHC"
-
@CMSExperiment on social media: facebook - twitter - instagram
- Do you like these briefings and want to get an email notification when there is a new one? Subscribe here